MCB Bank Limited (PSX: MCB)
Investment Summary
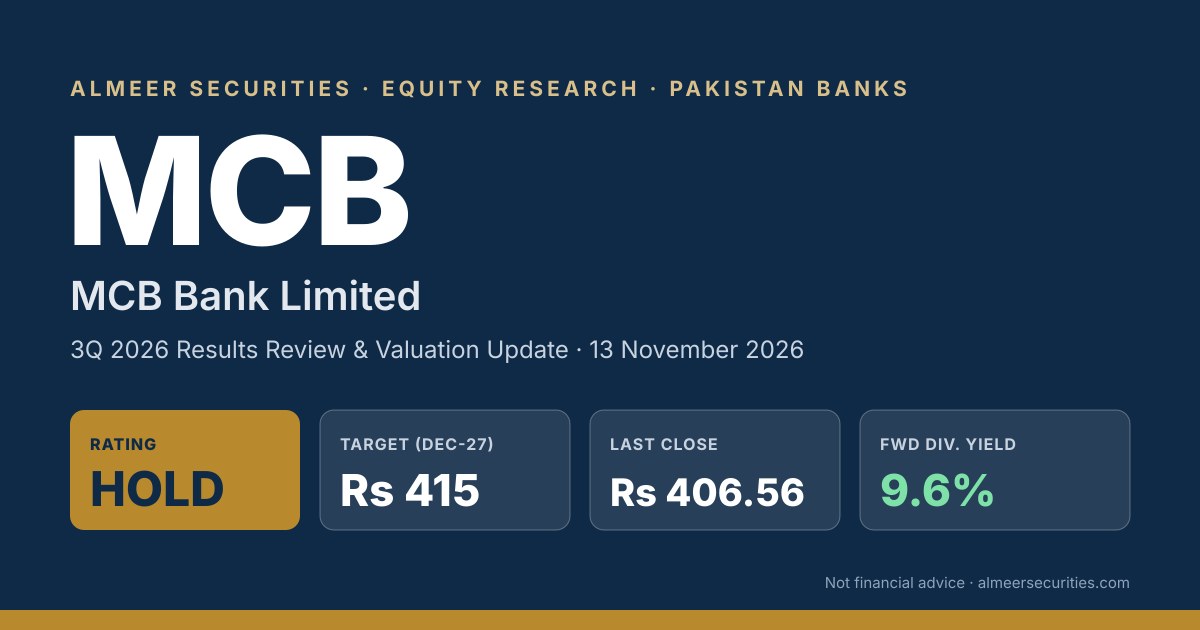
MCB is a high-quality, high-yield income stock, but most of the good news is already in the price. We initiate with a HOLD and a Dec-2027 target price of Rs 415. The stock offers an expected total return of about 11.7%: 2.1% price upside plus a 9.6% forward dividend yield. That is below our 17% cost of equity, so we see limited room for a re-rating at current levels.
- Earnings are turning up. Standalone 3Q26 EPS was Rs 12.61, up 8.3% YoY and 9.3% QoQ. This was the strongest quarter in at least five, helped by the SBP rate hikes.
- The deposit franchise is the edge. Domestic deposits grew by Rs 447bn in 9M26 to Rs 2.71tn. The CASA ratio is about 96% and current accounts are about 54% of deposits. This makes MCB one of the biggest winners when policy rates rise.
- Payout is reliable. The bank has paid Rs 9 per quarter (Rs 27 in 9M26). We expect a full-year DPS of Rs 36 in 2026E and Rs 40 in 2027E.
- Capital and asset quality are strong. CAR is 18.99%, CET1 is 14.80%, the infection ratio is 5.99% and coverage is 93.5%. Provisions were a net reversal in 9M26.
- Why not a BUY? Our 2027E EPS growth forecast is only 8%. The tax rate stays near 52%, and costs are rising 11% YoY. At about 1.4x P/B, the stock already trades at a premium to our justified multiple of about 1.2x.
3Q / 9M 2026 Results Review
9M26 standalone PAT was Rs 41.4bn (EPS Rs 34.95), up 0.8% YoY. PBT was Rs 86.3bn, down 1.3%, and the effective tax rate was about 52%. The quarter-by-quarter trend is improving, as the chart below shows.
| Key line items | Period | Value | YoY |
|---|---|---|---|
| Profit after tax (standalone) | 9M26 | Rs 41.4bn | +0.8% |
| Profit before tax (standalone) | 9M26 | Rs 86.3bn | -1.3% |
| EPS (standalone) | 9M26 | Rs 34.95 | +0.8% |
| EPS (consolidated) | 9M26 | Rs 37.26 | -0.4% |
| Net interest income (consol.) | 3Q26 | ~Rs 44bn | +7% |
| Non-funded income (consol.) | 3Q26 | – | +22% |
| Fee income | 3Q26 | Rs 7.1bn | +29% |
| Capital gains | 3Q26 | Rs 2.4bn | +158% |
| FX income | 3Q26 | Rs 2.2bn | -31% |
| Operating expenses (consol.) | 3Q26 | ~Rs 23bn | +11% |
| Cost-to-income | 3Q26 | ~42% | – |
| Provisions (consol.) | 3Q26 | Rs 0.47bn reversal | vs Rs 1.2bn charge |
| Interim cash dividend | 3Q26 | Rs 9.00 | Cum. Rs 27 in 9M26 |
Note: the 3Q income-statement split is from consolidated figures reported by PKRevenue. Totals are from MCB’s filing and press release.
Balance Sheet & Asset Quality
Deposit growth is the standout. Total deposits reached a record ~Rs 3.1tn, up 23% YoY and 4% QoQ. MCB’s 4% QoQ growth was third-best in the sector, which grew only 0.02% QoQ. The bank remains investment-heavy: the investment-to-deposit ratio is 78% against an ADR of 29%.
| Indicator | Sep-26 / 9M26 | Comment |
|---|---|---|
| Domestic deposits | Rs 2.71tn | +Rs 447bn vs Dec-25 (Rs 2.26tn) |
| Total deposits | ~Rs 3.1tn | +23% YoY |
| CASA ratio | ~96% | 95.9% at Jun-26; CA mix 54% at Dec-25 |
| Advances growth (9M) | +11% | vs industry +3%; market share 4.92% |
| Consumer financing | +Rs 17bn (+34%) | Fastest-growing loan segment |
| Investments | ~Rs 2.4tn | +10% YoY; ~70% floating-rate |
| Infection ratio | 5.99% | 6.76% at Dec-25 |
| Coverage ratio | 93.53% | 92.47% at Dec-25 |
| CAR / CET1 | 18.99% / 14.80% | Minimum CAR 11.5% |
| Home remittances | US$3.28bn | ~10% market share |
Macro Backdrop: Rates Are Moving MCB’s Way
The SBP has turned from cutting to hiking, and this helps MCB more than most banks. The policy rate bottomed at 10.5% in Dec-25. It was raised by 100bp in 2Q26 to 11.5% and by another 50bp to 12.0% from 27 Oct 2026. MCB’s investment book is about 70% floating-rate, and its fixed-rate portion has a short duration of about 1.9 years. Its funding is mostly zero-cost current accounts. So higher rates should feed into NII within a quarter or two.
Forecasts & Valuation
We value MCB at Rs 415 per share. This is a 50:50 blend of a dividend discount model (Rs 467) and a justified P/B (Rs 362). We use a cost of equity of 17.0% (risk-free rate 12.0%, beta 0.9, equity risk premium 5.5%) and long-term growth of 8%.
| Standalone (Rs) | 2024A | 2025A | 2026E | 2027E | 2028E |
|---|---|---|---|---|---|
| EPS | 48.62 | 45.73 | 48.0 | 52.0 | 55.5 |
| EPS growth | -3.4% | -5.9% | +5.0% | +8.3% | +6.7% |
| DPS | 36.0 | 36.0 | 36.0 | 40.0 | 42.0 |
| P/E (x) @ Rs 406.56 | 8.4 | 8.9 | 8.5 | 7.8 | 7.3 |
| Dividend yield | 8.9% | 8.9% | 8.9% | 9.8% | 10.3% |
A = actual, E = Almeer Securities estimate (shaded). 2026E assumes 4Q26 EPS of about Rs 13.0 and a 4Q dividend of Rs 9.
| Valuation method | Key inputs | Value (Rs) | Weight |
|---|---|---|---|
| Dividend discount (Gordon) | 2028E DPS Rs 42 / (17% − 8%) | 467 | 50% |
| Justified P/B | (ROE 19% − g 8%) / (Ke 17% − g 8%) = 1.22x × Dec-27E BVPS ~Rs 296 | 362 | 50% |
| Target price (Dec-27) | 415 |
DDM sensitivity (Rs/share) — the value moves sharply with the cost of equity:
| Ke \ g | 7% | 8% | 9% |
|---|---|---|---|
| 16% | 467 | 525 | 600 |
| 17% | 420 | 467 | 525 |
| 18% | 382 | 420 | 467 |
Book value per share (~Rs 280 at Sep-26, including revaluation surplus) is our estimate. We derived it from the ~1.35x P/B reported after results, as the full 3Q26 balance sheet was not available.
Peer Comparison
| Bank | Price (Rs) | P/E (x) | Div. yield | P/B (x) |
|---|---|---|---|---|
| MCB | 406.56 | 8.8 (TTM) | 8.9% (TTM) | ~1.4 |
| UBL | 437.23 | 7.6 (TTM) | 7.2% (indicated) | 2.7 (2Q26) |
| HBL | 310.65 | 6.3 (9M26 ann.) | 7.7% (9M26 ann.) | – |
| Meezan Bank | – | – | 5.8% (2026E) | 3.1 |
| Sector | – | 8.1 (2026E) | – | 1.5 |
Prices are as of 12 Nov 2026. Multiples come from mixed sources and dates, so treat them as indicative. MCB TTM EPS = 9M26 EPS 34.95 + 4Q25 EPS 11.05 = Rs 46.0.
MCB has the highest dividend yield among the large private banks. It trades at a discount to UBL and Meezan, which earn higher ROEs, and roughly in line with the sector on P/B.
Catalysts & Risks
Upside triggers:
- The full benefit of the 150bp of rate hikes shows up in 4Q26 and 1H27 NII.
- A higher dividend: the DPS could rise to Rs 10 per quarter, given the 76% payout and strong capital.
- Faster growth in consumer and SME lending raises the ADR and asset yields.
- Lower bank taxation in the FY28 budget.
Downside risks:
- The SBP returns to rate cuts sooner than expected, which compresses margins.
- Further tax measures on banks, such as super tax or ADR-linked levies.
- Cost inflation (opex +11% YoY) runs ahead of revenue.
- Volatile capital gains and FX income, which made up a large share of non-funded income in 3Q26.
- Asset quality worsens as the consumer book grows quickly.
Sources: PSX – MCB company page · Business Recorder – MCB 9M26 results · PSX filing summary (FinHisaab) · Mettis Global – consolidated P&L · PKRevenue – 3QCY26 breakdown · Chase Securities – corporate briefing notes · MCB Corporate Briefing (Apr 2026) · SBP – policy rate · Express Tribune – sector 9M26 · BOL News – sector valuations · PSX – UBL · Closing prices 12 Nov 2026
Disclaimer: This report has been prepared by Almeer Securities for information purposes only. It is not an offer or solicitation to buy or sell any security. The information comes from sources believed to be reliable, but its accuracy and completeness are not guaranteed. Estimates and opinions are as of the date of this report and may change without notice. Investors should make their own decisions based on their own objectives and consult a licensed advisor. Almeer Securities and/or its employees may hold positions in the securities mentioned.
© 2026 Almeer Securities. All rights reserved.