The dividend machine that the market stopped paying for
Indus Motor sold 45,035 vehicles in FY26, earned Rs 25.5 billion and will hand shareholders Rs 195 a share. The stock is down 11% over the year. Almeer Securities looks at what happened between 2024 and today, and at whether a 10% dividend yield is as generous as it looks.
On the evening of 29 August 2026, the board of Indus Motor Company met in Karachi and recommended a final cash dividend of Rs 47 per share. Added to the three interim dividends already paid during the year, that takes the total for the year ended 30 June 2026 to Rs 195 per ordinary share, 1,950% of the Rs 10 face value, and the largest cash distribution in the company's 37-year history.
It is the kind of number that stops a retail investor mid-scroll. At the current share price of Rs 1,950, an investor buying today and receiving a repeat of that payout collects exactly 10% of their money back in cash every year, before any movement in the share price at all.
And yet the market has spent the last twelve months marking this stock down. Indus Motor has fallen roughly 11–17% over the past year depending on the measurement date, while the KSE-100 index rose 18.3%. That is a gap of nearly thirty percentage points against the market, delivered in a year when the company grew revenue 20%, grew unit sales 33% and grew earnings 11%.
Something in that picture does not add up. This report goes through the FY26 accounts line by line to work out which half of it is wrong: the operating performance, or the price.
Section oneWhat actually happened between 2024 and now
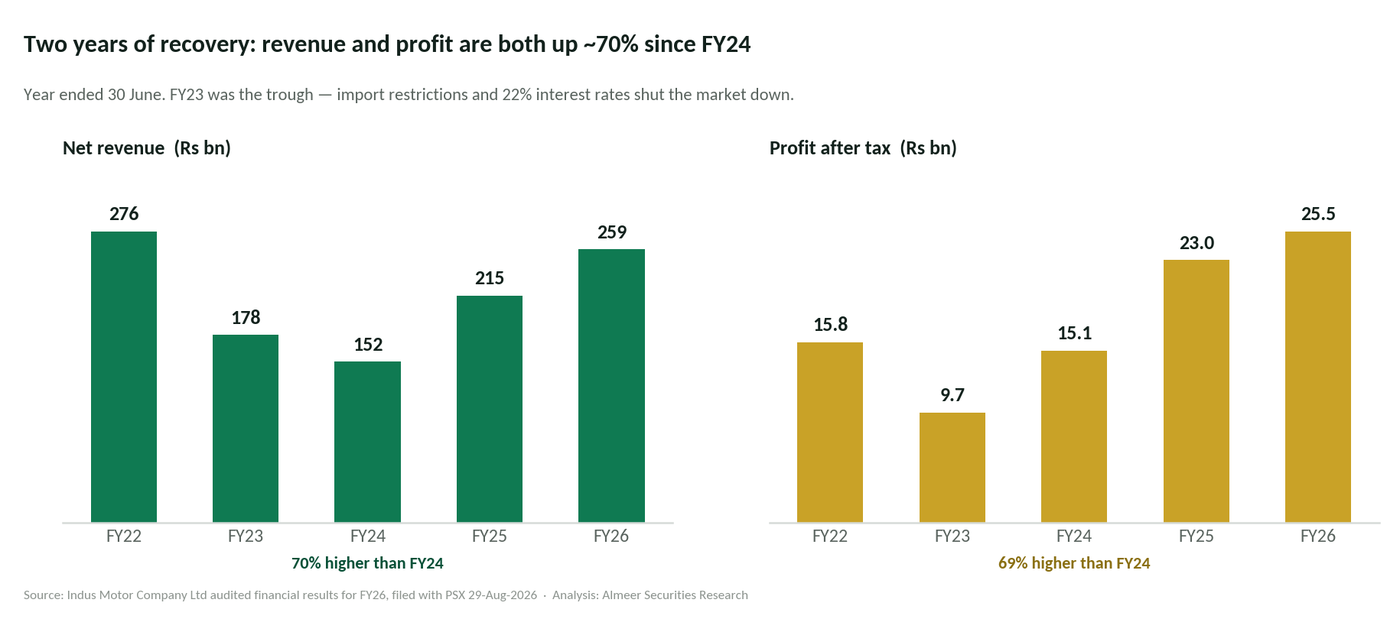
To understand FY26 you have to start two years earlier. FY23 and FY24 were brutal years for every assembler in Pakistan. Import restrictions choked the supply of CKD kits, the policy rate peaked at 22%, and auto financing effectively disappeared. Indus Motor's revenue fell from Rs 275.5 billion in FY22 to Rs 152.5 billion in FY24, a 45% collapse in two years, and the company was running its plant on non-production days.
What has happened since is one of the sharper recoveries on the Pakistan Stock Exchange.
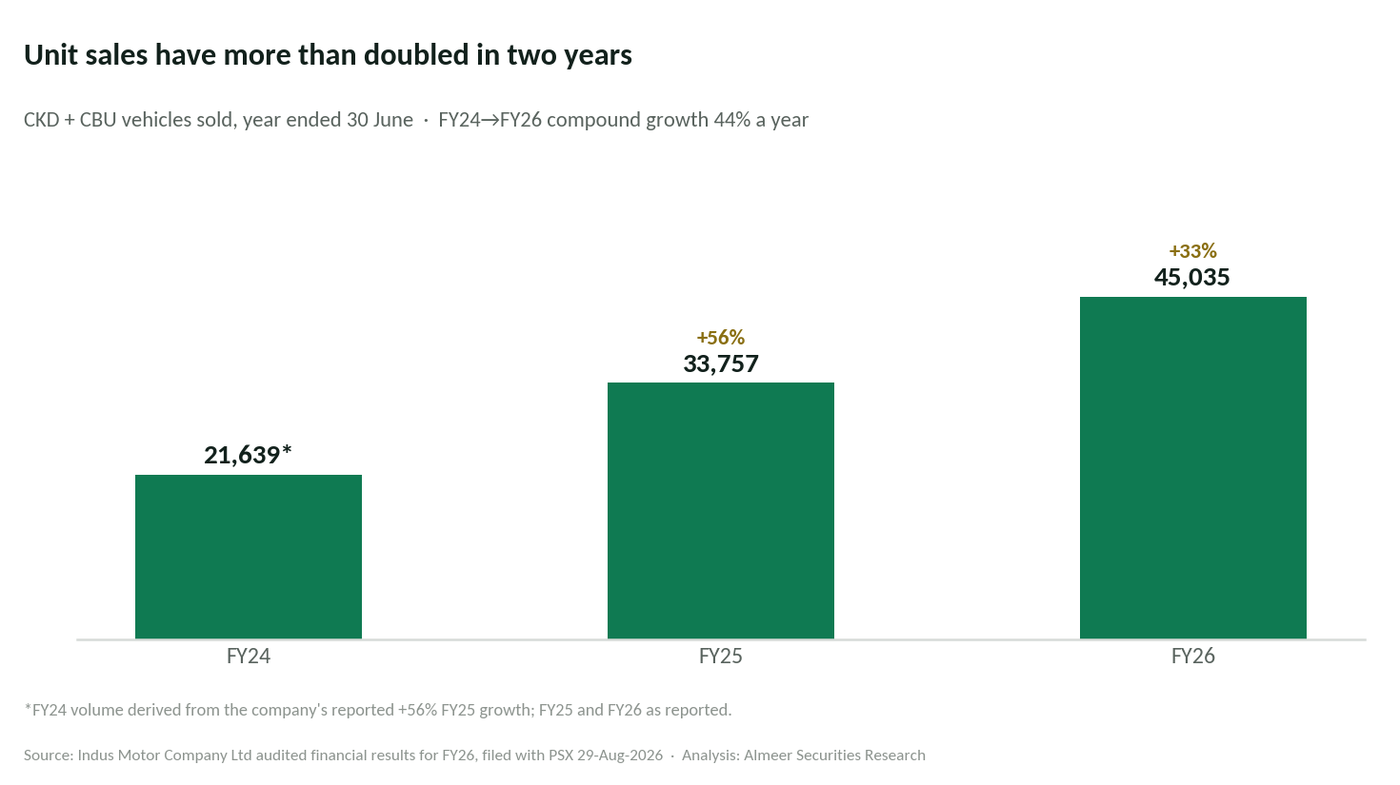
The engine of that recovery is volume. The company sold 45,035 CKD and CBU units in FY26 against 33,757 in FY25 and roughly 21,600 in FY24. Production rose 37% to 45,597 units. In two years Indus Motor has more than doubled the number of vehicles it puts on Pakistani roads.
That volume did not come from nowhere. The State Bank cut the policy rate from 22% in mid-2023 to a low of 10.5% by December 2025, auto financing returned, and the industry as a whole grew 39% in FY26 to 206,445 units. Indus Motor rode a rising tide, but it also held its position on it.
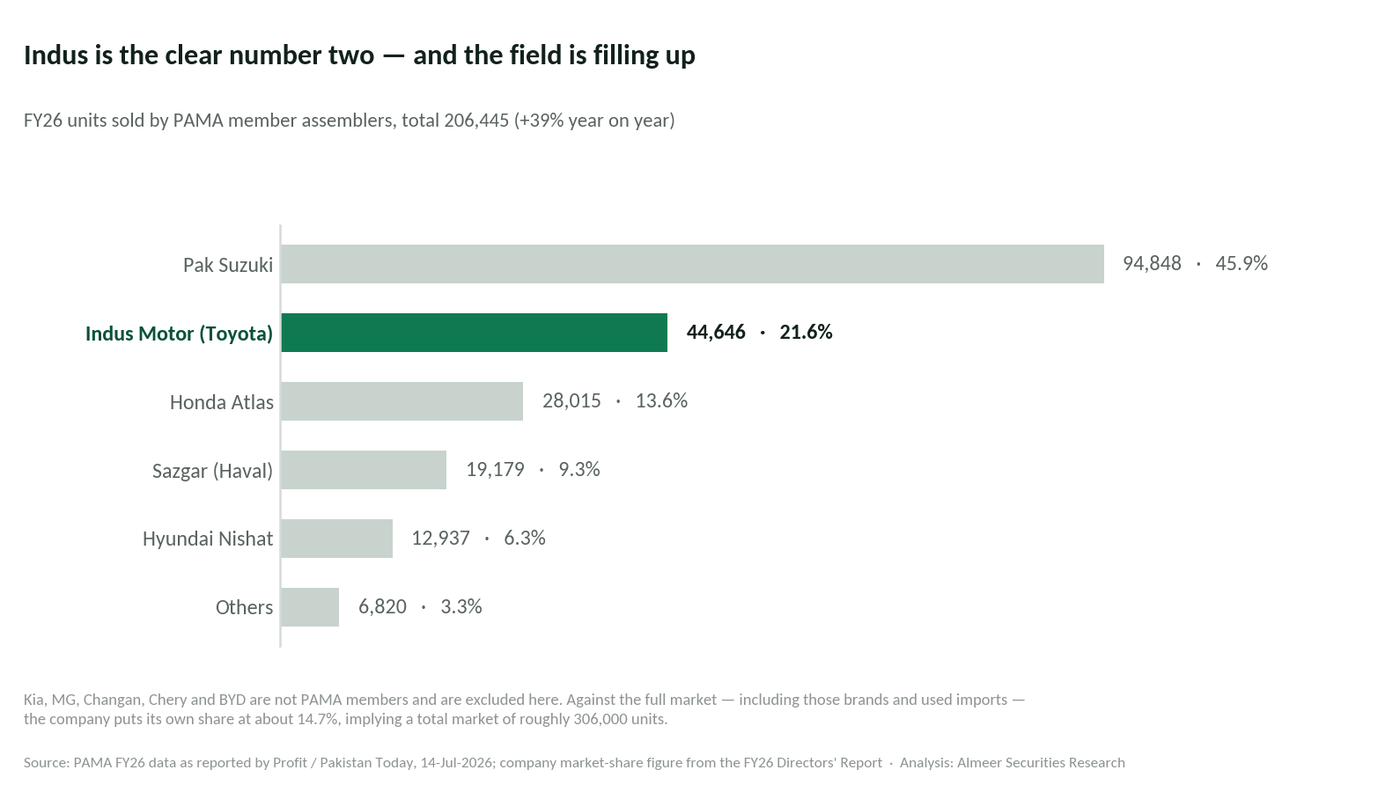
Two things about that chart deserve attention. The first is that Toyota remains the strongest brand in the country outside Suzuki's small-car stronghold. The second is that Sazgar, selling Haval SUVs, grew 77% in FY26, faster than anyone. In the third quarter alone, Haval sold more than twice as many units as Indus Motor's entire Fortuner and IMV range. The SUV segment, which used to belong to Toyota by default, is now genuinely contested.
Section twoThe margin story nobody is talking about
Here is where the headline numbers begin to mislead. Revenue grew 20.3% in FY26. Profit after tax grew only 10.8%. The gap between those two numbers is the whole story of the year.
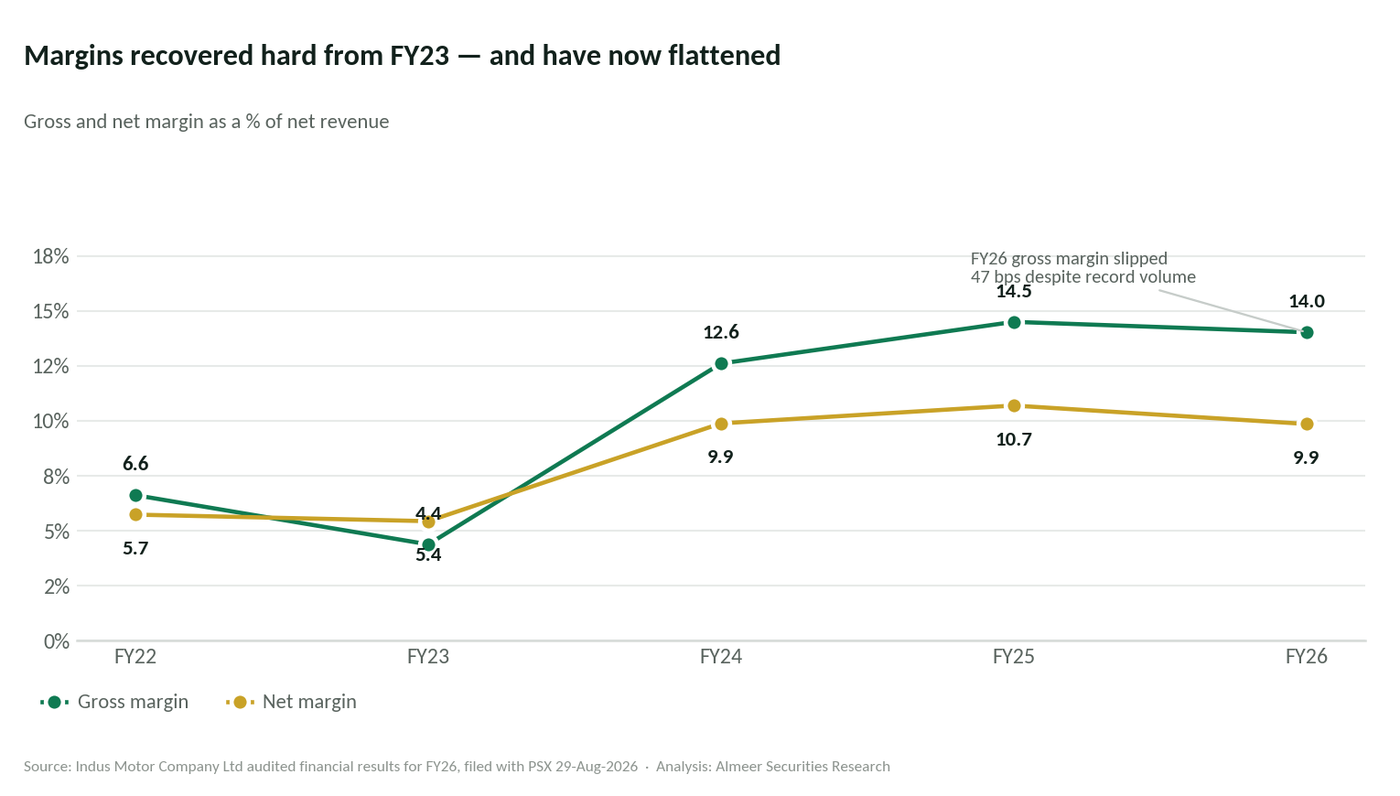
A 47 basis point decline in gross margin does not sound like much. But it arrived in the year the company had its highest volumes ever, which is precisely when a manufacturer should be enjoying its best operating leverage. Fixed costs spread over 45,035 units should be cheaper per car than the same costs over 33,757 units. Margin should have expanded. It did not.
The reason becomes obvious when you look at what the company is actually selling.
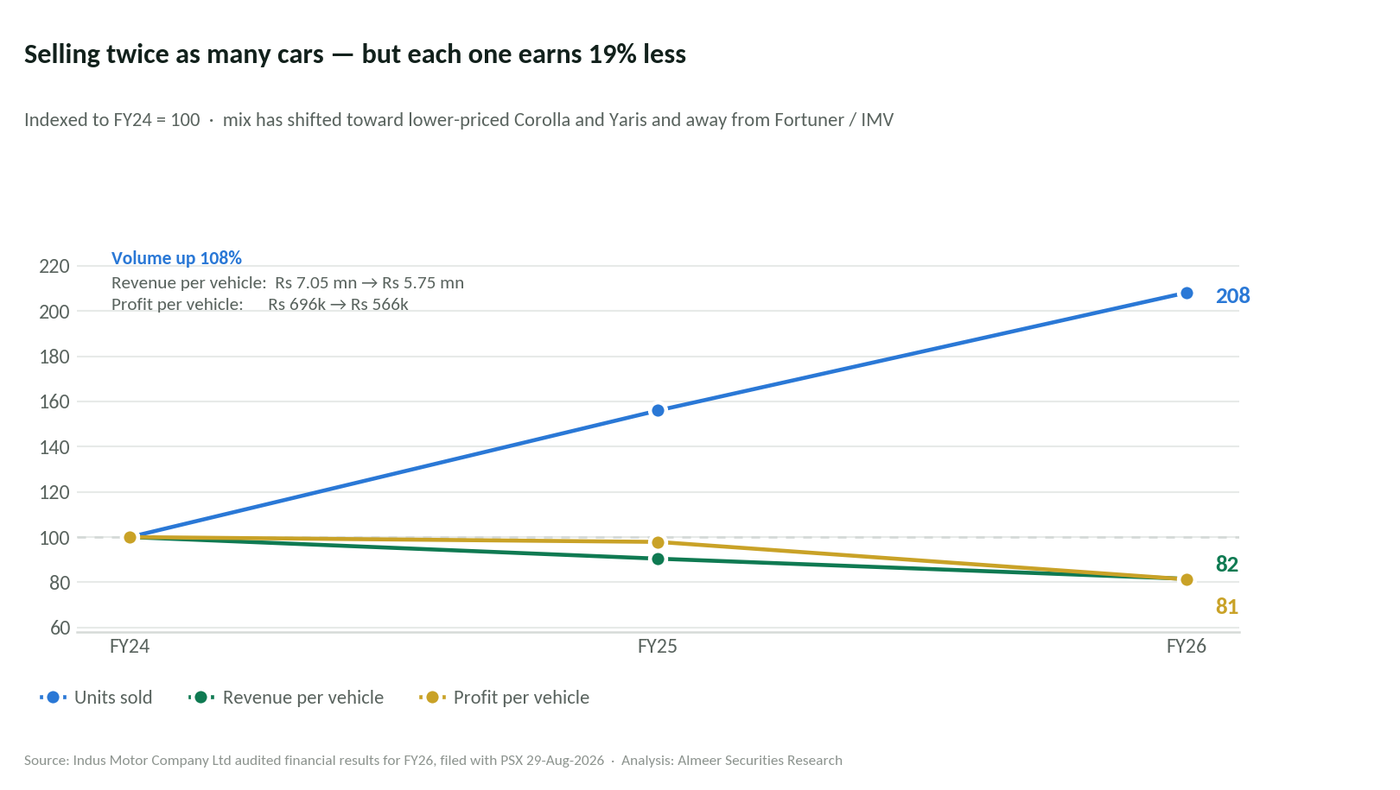
The mix shift is visible in the industry data. Corolla, Yaris and Corolla Cross together sold 35,831 units in FY26, up 42%. The Fortuner and IMV range, the high-margin end of the portfolio, grew only 8%, to 8,815 units. The growth is coming from the cheaper half of the showroom.
This is not necessarily bad management. Defending volume and market share in a recovering market is a rational choice, and localisation gains have offset part of the pricing pressure. But it does mean the operating leverage story that investors were expecting has not materialised, and it explains a great deal of why the share price has gone sideways while profits rose.
Section threeThe dividend, examined properly
Now to the question that brings most investors to this stock. Indus Motor's dividend record is, on its face, exceptional. Over the last three financial years the company has paid Rs 485.70 per share in cash, roughly a quarter of today's entire share price, returned in three years.
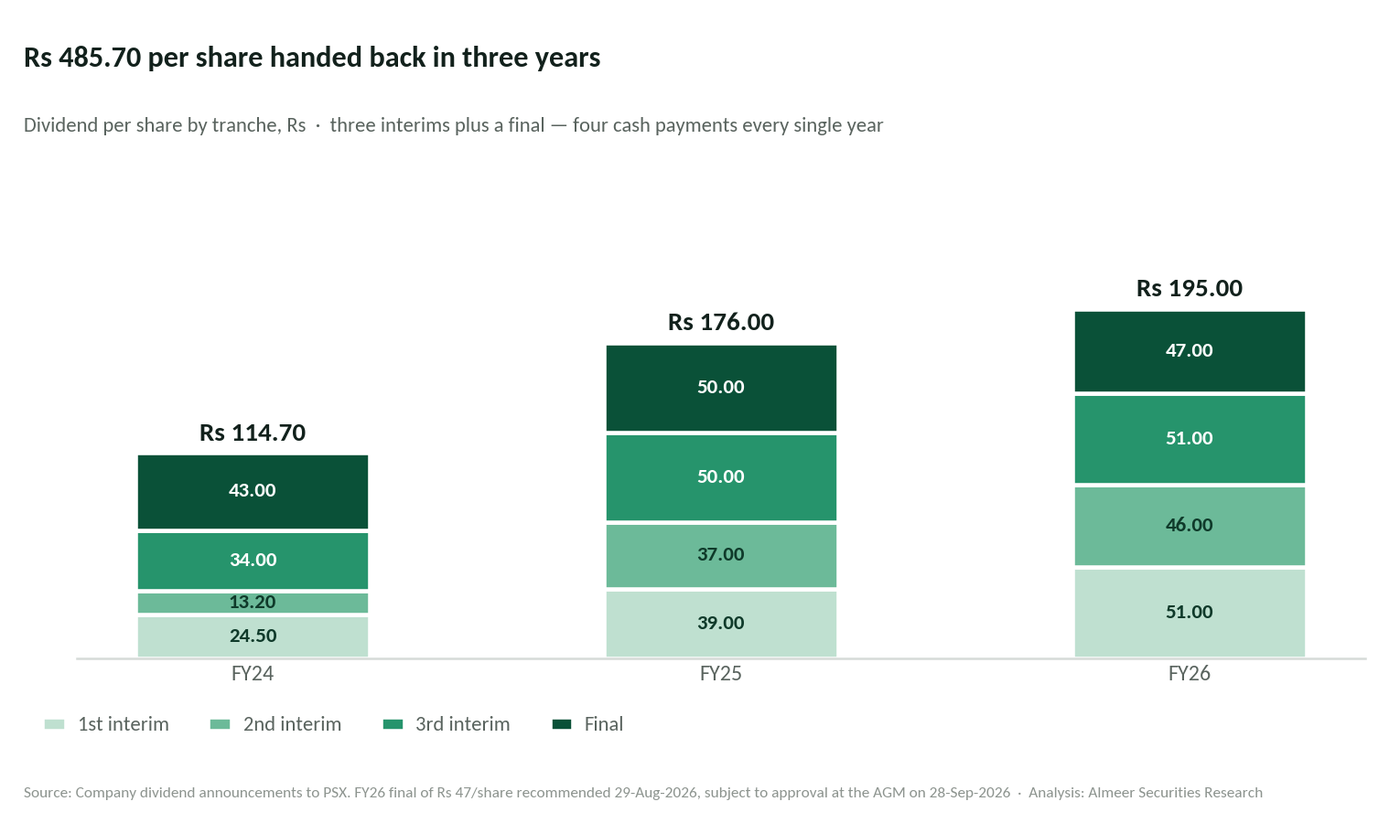
What makes this a genuine policy rather than a series of lucky years is the consistency of the payout ratio.
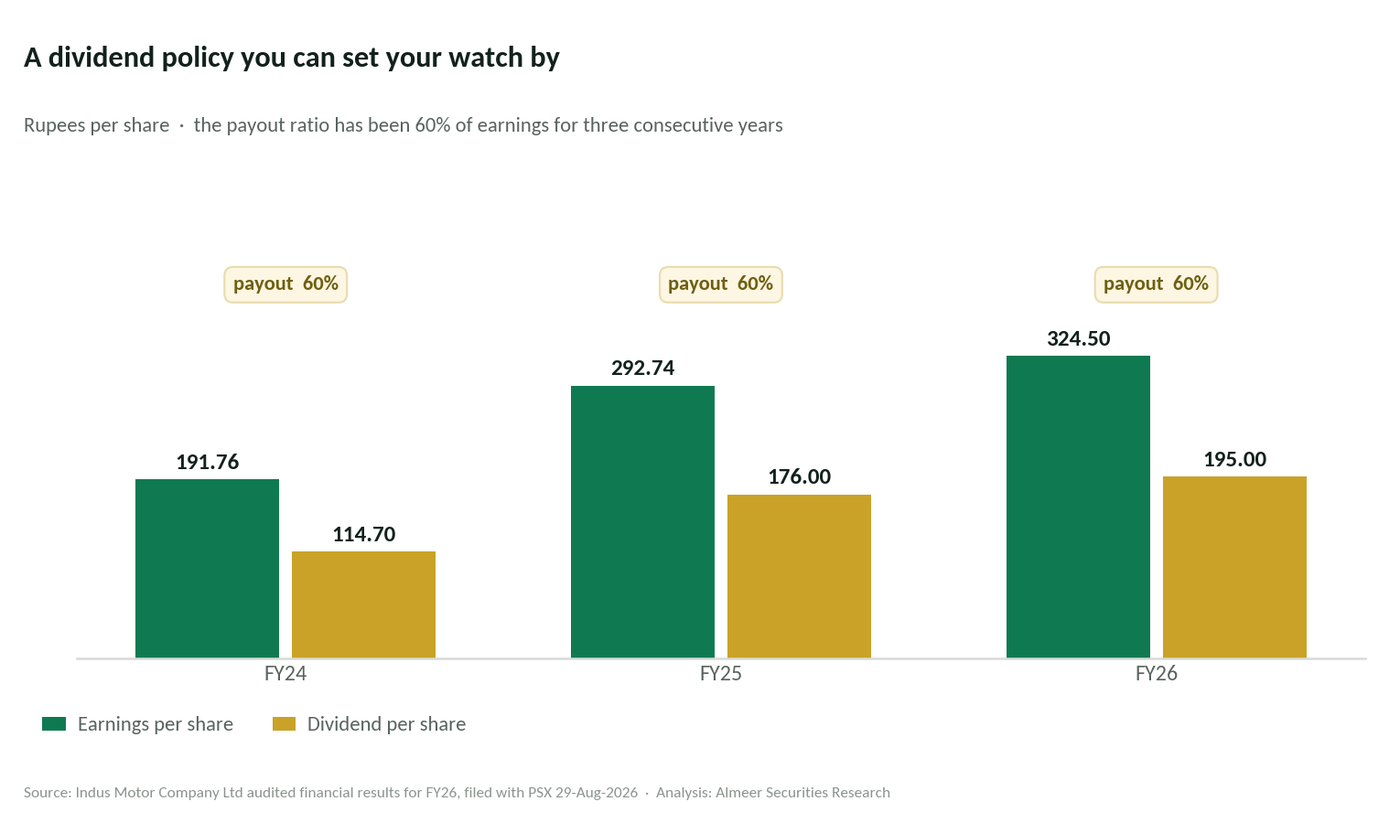
For an income investor, that predictability is worth a great deal. It means the dividend can be forecast from the earnings forecast, and it means management is not tempted to flatter shareholders in a weak year by paying out more than the business earned. Earnings cover of 1.66× has been maintained in all three years.
| Financial year | EPS (Rs) | DPS (Rs) | Payout | Cash cost (Rs bn) | Earnings cover |
|---|---|---|---|---|---|
| FY2024 | 191.76 | 114.70 | 59.8% | 9.02 | 1.67× |
| FY2025 | 292.74 | 176.00 | 60.1% | 13.83 | 1.66× |
| FY2026 | 324.50 | 195.00 | 60.1% | 15.33 | 1.66× |
| Three-year total | 809.00 | 485.70 | 60.0% | 38.18 | 1.67× |
Rs 38.2 billion returned to shareholders in three years, from a company whose entire market capitalisation is Rs 153.3 billion. On the current dividend, held flat, an investor recovers their whole purchase price in cash in ten years.
The part that requires more care
A dividend is only as good as the cash behind it. And in FY26, for the first time in years, the cash was not there.
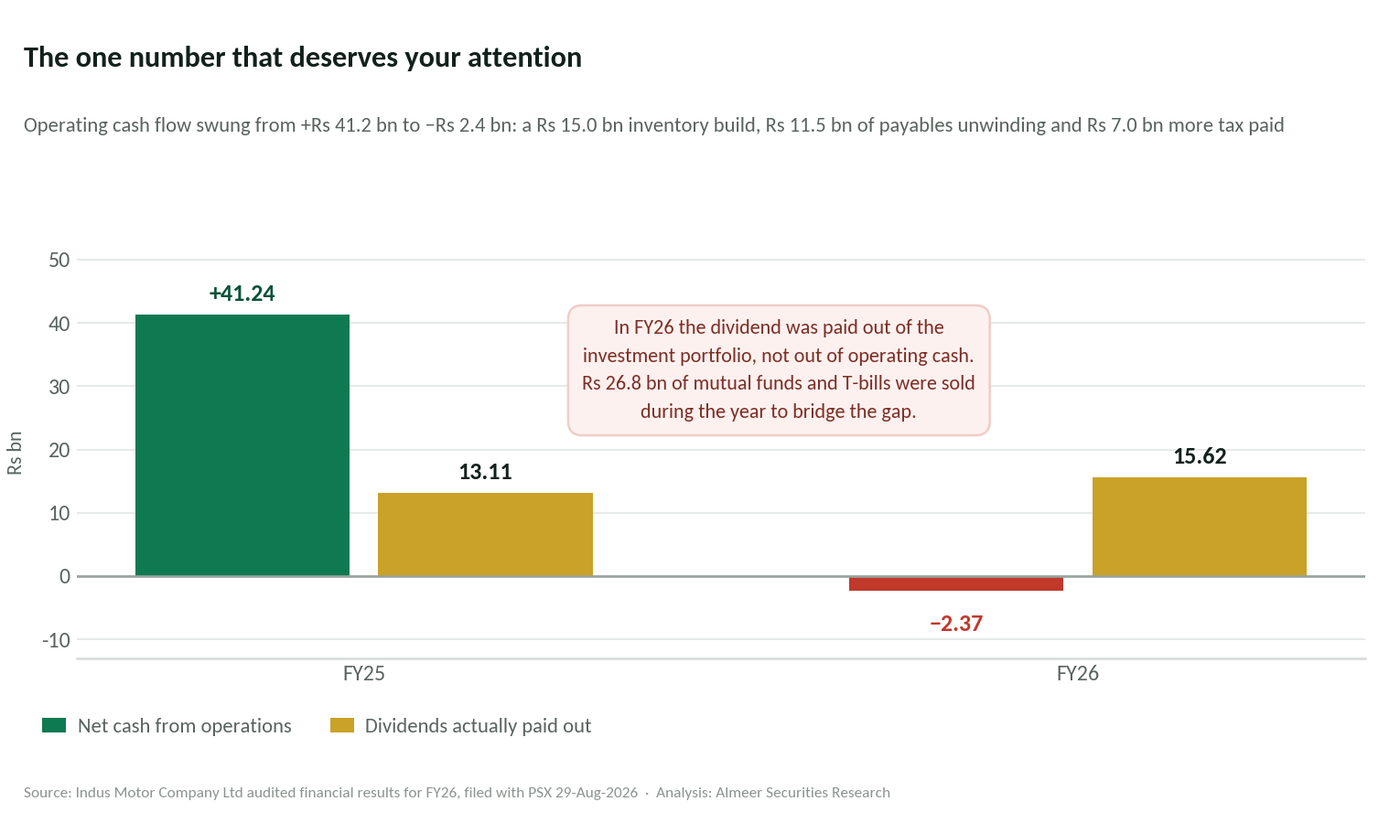
This deserves to be understood properly rather than panicked about. The swing is almost entirely working capital and tax, not a deterioration in the underlying business:
| Movement | Effect on cash |
|---|---|
| Stock-in-trade built up (Rs 21.8 bn → Rs 36.8 bn) | −15.03 |
| Trade and other payables unwound | −11.53 |
| Advances from customers reduced | −3.06 |
| Warranty obligations settled | −1.67 |
| Trade debts collected | +7.11 |
| Other working capital, net | +0.48 |
| Net working-capital swing | −23.70 |
| Income tax and levy paid (vs Rs 13.68 bn in FY25) | −20.71 |
| WPPF, WWF and Sindh Infrastructure Cess paid | −4.65 |
| Net cash used in operating activities | −2.37 |
Two-thirds of the problem is a Rs 15 billion inventory build. A company that expects to keep growing volumes stocks up on kits and finished vehicles, and Indus Motor now carries Rs 36.8 billion of stock against Rs 21.8 billion a year ago. If those cars sell, the cash comes back. If demand softens, that inventory becomes a very expensive mistake, and the Q4 numbers, which we come to shortly, suggest demand did soften.
The remaining third is tax. The company paid Rs 20.7 billion in income tax and levy during FY26 against Rs 13.7 billion the year before, and its effective tax rate rose to 40.4% from 38.6%. That is a permanent feature of operating in Pakistan, not a timing item.
What this means for the dividend. In FY26 the Rs 15.6 billion of dividends was funded by liquidating investments, not by operating cash. The company sold Rs 24.9 billion of mutual fund units and Rs 12.3 billion of Treasury bills during the year, generating a Rs 26.8 billion inflow from investing activities that more than covered the gap.
With Rs 111.6 billion of net cash still on the balance sheet, Indus Motor could fund the FY26 dividend out of its investment portfolio alone for the better part of seven years. This is not a solvency question. But it is a reminder that a 10% yield paid out of a shrinking cash pile is a different proposition from a 10% yield paid out of operating profit, and investors should watch the FY27 cash flow statement closely.
Section fourThe company is worth less than its bank balance suggests
This is the most striking single fact in the FY26 accounts, and it is the reason the stock is difficult to dismiss even after a poor year of price performance.
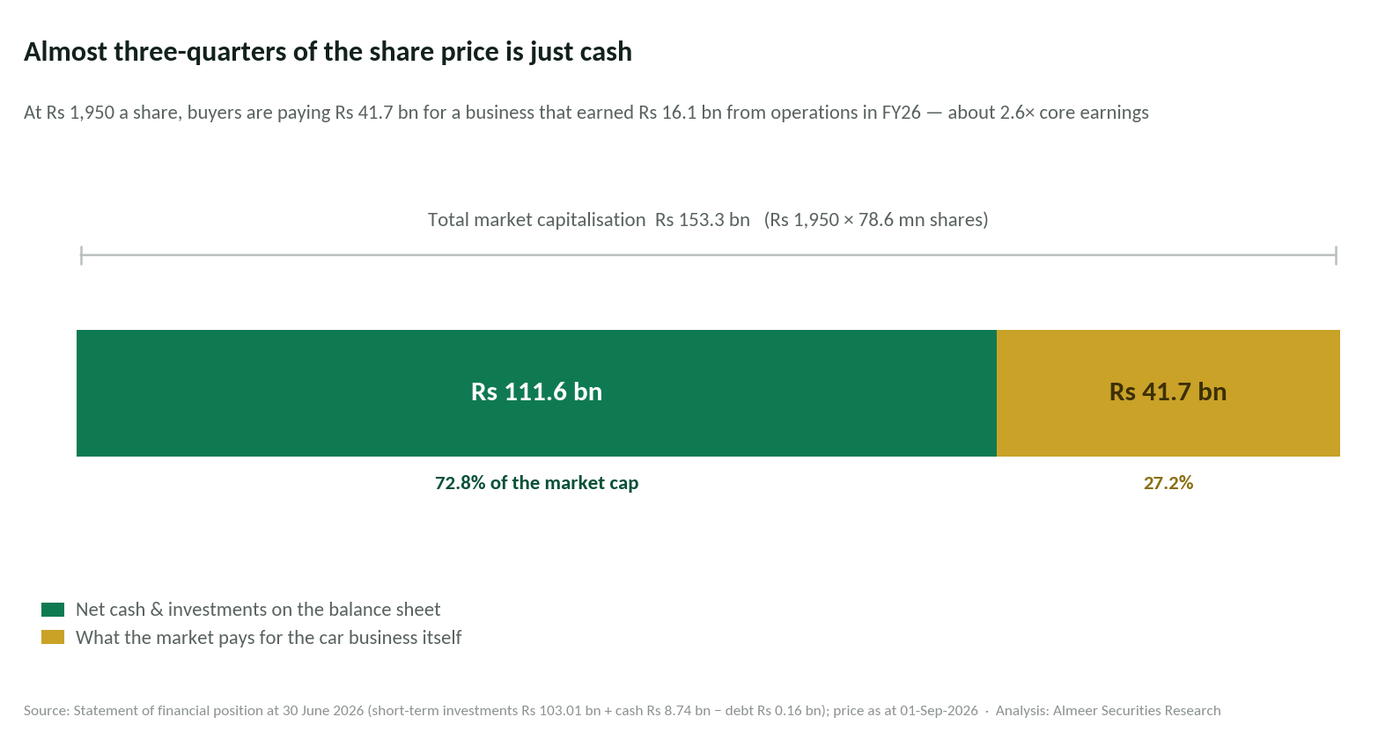
Take the share price of Rs 1,950 and subtract the Rs 1,420 per share of net cash and investments. The market is valuing the actual business of assembling and selling Toyota vehicles in Pakistan, the plant at Port Qasim, the dealer network, the Toyota licence, 45,000 units a year of production, at Rs 530 per share, or Rs 41.7 billion in total.
Strip the investment income out of the profit and loss account and that same business generated Rs 27.0 billion of pre-tax operating profit in FY26, or roughly Rs 16.1 billion after tax: Rs 204 per share of core earnings.
| Per share (Rs) | Total (Rs bn) | Implied multiple | |
|---|---|---|---|
| Share price, 1 Sep 2026 | 1,950 | 153.3 | 6.0× reported EPS |
| Less: net cash and investments | 1,420 | 111.6 | — |
| Paid for the operating business | 530 | 41.7 | — |
| Core operating earnings, after tax | 204 | 16.1 | 2.6× core earnings |
| Investment income, after tax | 120 | 9.4 | 37% of total profit |
Two and a half times earnings for the Toyota franchise in a market that just grew 39% is, on any conventional reading, an extremely low price. The market is telling you it does not believe those core earnings are durable.
The counter-argument, stated fairly. That cash pile is not free money waiting to be handed out. Rs 31.0 billion of the balance sheet is advances taken from customers and dealers who have paid for cars they have not yet received; Rs 47.2 billion is trade and other payables. A large part of what looks like "the company's cash" is other people's money passing through, and it is the working capital that keeps a high-volume assembly operation running.
There is also the small matter of what that cash does. It earns interest and investment income: Rs 15.9 billion of it in FY26, or 37% of pre-tax profit. Distribute the cash and you lose more than a third of the earnings. The two halves of the valuation are not fully separable.
Section fiveThe quarter that should worry you
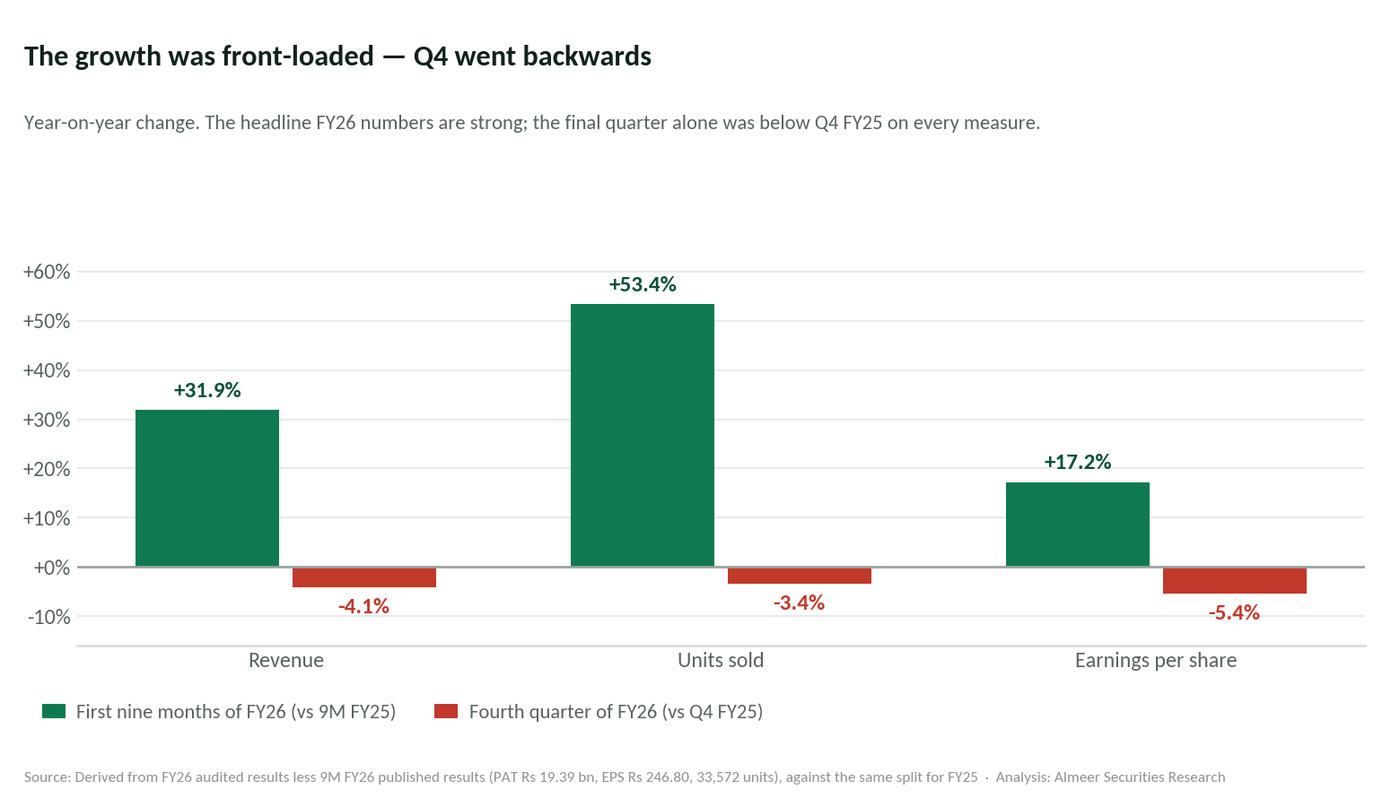
Annual results flatten out the shape of a year. Splitting FY26 into its first nine months and its fourth quarter changes the picture considerably.
| 9M FY26 | 9M FY25 | Change | Q4 FY26 | Q4 FY25 | Change | |
|---|---|---|---|---|---|---|
| Revenue (Rs bn) | 191.97 | 145.53 | +31.9% | 66.78 | 69.61 | −4.1% |
| Units sold | 33,572 | 21,890 | +53.4% | 11,463 | 11,867 | −3.4% |
| Earnings per share (Rs) | 246.80 | 210.62 | +17.2% | 77.70 | 82.12 | −5.4% |
Every one of the impressive full-year growth rates was earned in the first three quarters. In the fourth quarter, April to June 2026, Indus Motor sold fewer cars, booked less revenue and earned less per share than in the same quarter a year earlier.
Some of this is a hard comparison: Q4 FY25 was an exceptionally strong quarter, accounting for 35% of that year's entire volume. But it coincides with two developments worth noting. The State Bank raised the policy rate by 100 basis points to 11.5% in April 2026 and has held it there since, making auto financing more expensive again. And the Rs 15 billion inventory build happened over the same period in which sales stopped growing.
Read together with the negative operating cash flow, the fourth quarter is the single strongest argument the bears have.
Section sixThe yield in context
A 10% dividend yield is only attractive relative to what else your money could earn. In Pakistan in September 2026, that comparison is less flattering than it first appears.
| Option | Return | Risk |
|---|---|---|
| SBP policy rate | 11.50% | Risk-free benchmark |
| Indus Motor dividend yield, FY26 payout | 10.00% | Equity; dividend not guaranteed |
| Indus Motor total return, last 12 months | roughly −3% to −7% | Dividend received, capital lost |
| KSE-100 index, last 12 months | +18.3% | Broad market |
The dividend yield sits 150 basis points below the risk-free rate. An investor who bought Indus Motor a year ago for the income has collected roughly Rs 195 of dividends and lost more than that in share price. That is the honest arithmetic of the last twelve months, and any research note that celebrates the yield without stating it is not doing its job.
The bull case therefore cannot rest on the yield alone. It has to rest on the yield plus a re-rating of a business trading at 2.6× its core earnings, and a re-rating requires the market to change its mind about whether those earnings last.
Section sevenWhat would have to go right, and what could go wrong
The case for owning it
- Rs 111.6 bn of net cash, 72.8% of the market capitalisation, and effectively no debt. The downside is heavily cushioned.
- 2.6× core earnings for the Toyota franchise once cash is stripped out. There is very little optimism in this price.
- A 60% payout formula held through three very different years. The dividend is predictable in a market where little else is.
- Volume more than doubled in two years and the industry is forecast to grow again in FY27 as rates eventually ease.
- Return on equity of 31%, sustained. This is a genuinely high-quality business, not a value trap by asset backing alone.
- Contributed Rs 140 bn to the exchequer in FY26, about 1% of all federal tax revenue. The company's strategic position is not in question.
The case for staying away
- Q4 FY26 went backwards on volume, revenue and earnings. The growth story may already be over.
- Operating cash flow was negative and the dividend came out of the investment portfolio. Watch FY27 closely.
- Rs 36.8 bn of inventory, up 69%, sitting against a quarter in which sales fell.
- Profit per vehicle down 19% in two years. Volume growth is not reaching the bottom line.
- The yield is below the policy rate. You are taking equity risk for less than a T-bill pays.
- Competition is intensifying. Haval, MG, Changan, Kia and Hyundai are taking the SUV segment, and used imports are around 19% of demand.
- 37% of profit is investment income, which falls with interest rates. A rate-cutting cycle helps car sales and hurts this line simultaneously.
- 17.8% free float. Thin liquidity; Toyota Motor Corporation, Toyota Tsusho, House of Habib and Thal Limited hold the rest.
Almeer Securities' view. Indus Motor is not a growth story any more, and investors who buy it expecting the FY25 and FY26 volume trajectory to continue are likely to be disappointed; the fourth quarter has already told us that. It is something different and, for the right investor, more interesting: a dominant franchise with a fortress balance sheet, trading at a price that assumes its operating profit is worth almost nothing.
For an income-focused portfolio, the Rs 195 dividend is real, is covered 1.66 times by earnings, and rests on Rs 111.6 billion of liquid assets. For a total-return portfolio, the question is narrower and harder: does the market re-rate a business at 2.6× core earnings, or does it keep discounting it because a third of the profit comes from a cash pile that shrinks as rates fall? We think the balance sheet makes the downside unusually well protected, and the fourth quarter makes the upside unusually dependent on FY27 volumes recovering.
Investors should treat the FY27 first-quarter result, due around late October 2026, as the decisive data point: it will show whether the Rs 15 billion of inventory is turning into sales, or into a problem.
Sources and basis of analysis
- Indus Motor Company Limited: audited financial results and Directors' Report for the year ended 30 June 2026, filed with the Pakistan Stock Exchange on 29 August 2026. All FY26 and FY25 income statement, balance sheet, cash flow and equity figures are taken directly from this filing.
- Pakistan Stock Exchange data portal, dps.psx.com.pk/company/INDU: share price, market capitalisation, shares outstanding and free float as at 1 September 2026.
- Company dividend announcements to PSX, and dividend history as compiled by Investing.com and StockAnalysis.com, for FY24 and FY25 tranche detail.
- FY22, FY23 and FY24 income statement figures from StockAnalysis.com PSX:INDU financials, cross-checked against the company's own FY24 results announcement.
- Nine-month FY26 results (revenue Rs 191.97 bn, profit after tax Rs 19.39 bn, EPS Rs 246.80, 33,572 units) as reported by The News, 28 April 2026.
- Industry volume data: PAMA FY26 figures as reported by Profit / Pakistan Today, 14 July 2026.
- Business Recorder, "IMC records impressive 33pc growth in unit sales" and "INDU: Road ahead is crowded", for management commentary and competitive context.
- State Bank of Pakistan policy rate history via Trading Economics; KSE-100 index level and 12-month performance via Trading Economics and the PSX indices portal.
Derived figures. FY24 unit sales, the fourth-quarter split, core operating earnings excluding investment income, net cash per share, and all ratios and growth rates in this report are calculated by Almeer Securities Research from the sources above. Where a figure is derived rather than reported, the report says so.
Disclaimer. This report has been prepared by Almeer Securities (Pvt.) Limited for information purposes only. It is not, and should not be construed as, an offer to buy or sell any security, nor as investment advice or a personal recommendation. It does not take account of the investment objectives, financial situation or particular needs of any individual investor.
The information in this report has been obtained from sources believed to be reliable, including the company's own filings with the Pakistan Stock Exchange, but Almeer Securities makes no representation or warranty as to its accuracy or completeness. Figures described as derived or estimated are the analyst's own calculations and may differ from figures the company subsequently reports. Past performance is not a guide to future performance, and dividends are not guaranteed and may be reduced or withheld.
Investing in equities involves risk, including the possible loss of the amount invested. Investors should form their own view, and where appropriate seek independent advice, before dealing. Almeer Securities (Pvt.) Limited, its directors and employees may hold positions in the securities mentioned. Almeer Securities (Pvt.) Limited is a corporate member of the Pakistan Stock Exchange, regulated by the Securities and Exchange Commission of Pakistan.